Bellabeat Report
- Tech Stack: R, rmarkdown
- Github URL: click here
- Full rmarkdown Report: click here
1. Introduction
This project report presents a data analysis case study of Bellabeat, a company that manufactures health-focused smart products for women. The aim of this study is to gain insights into user behavior, daily habits, activity levels, sleep patterns, and stress levels of women using Bellabeat's products. By analyzing the available data, the report seeks to refine Bellabeat's products, develop targeted marketing campaigns, and provide personalized recommendations to improve user experience.
2. Problem Statement
Bellabeat aims to gain a deeper understanding of how women utilize their smart devices to refine their products, develop marketing strategies, and provide personalized recommendations. To achieve this, the company needs comprehensive insights into user behavior, daily habits, activity levels, sleep patterns, and stress levels. By analyzing the available data, Bellabeat aims to extract meaningful insights to enhance their understanding of user behavior and improve their products, marketing strategies, and user experience.
3. Data Wrangling and Preprocessing
In preparation for analysis, I conducted a thorough data cleaning and data transformation process. The following steps were taken:
Handling Missing Values: Imputed the data points using the mean.
Removing Duplicates: Eliminated duplicate records to maintain data integrity.
Data Type Editing: timestamp data was converted to date-time format and split into date and time for better analysis.
4. Data Analysis and Visualization
4.1 Relationship between Steps and Sedentary Time

The above plot shows the relationship between the total steps taken in a day and the amount of time spent in sedentary activities. Each point represents a participant's data. The x-axis represents the total steps taken, while the y-axis represents the sedentary minutes. The points are scattered across the plot, indicating that there is no clear linear relationship between steps and sedentary time. However, there is a slight negative trend, suggesting that as the total steps increase, the sedentary time tends to decrease.
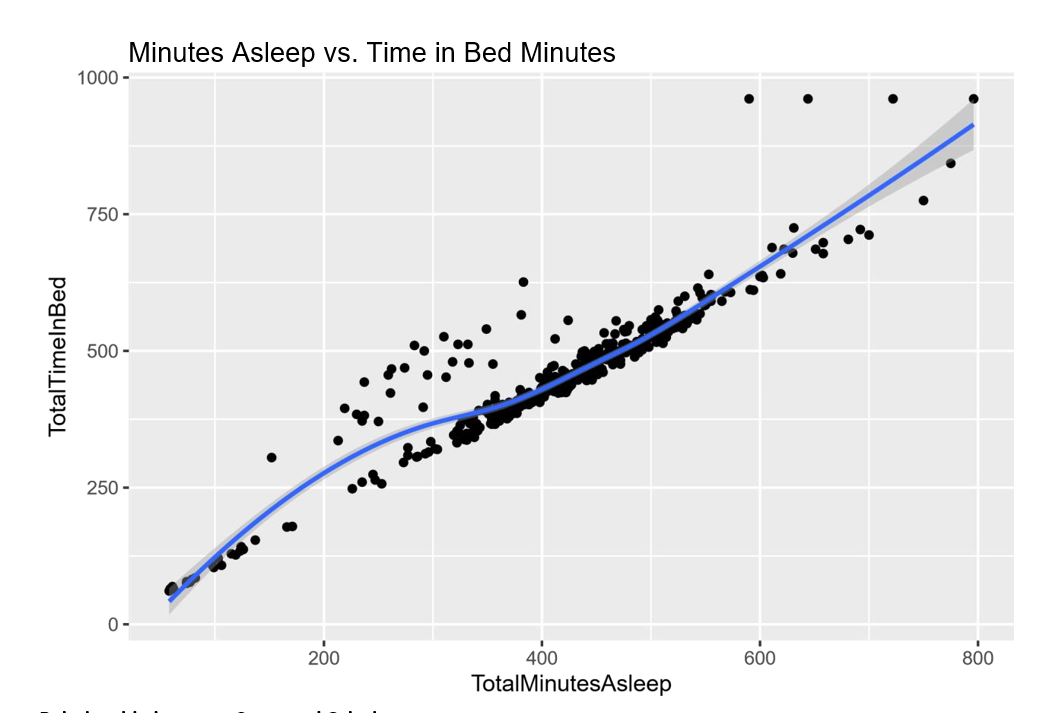
4.2 Relationship between Minutes Asleep and Time in Bed

The above plot displays the relationship between the total minutes asleep and the total time spent in bed. The points are scattered across the plot, showing the varying patterns of sleep duration and time spent in bed. There is a positive correlation, indicating that participants who spend more time in bed also tend to have more minutes of sleep.
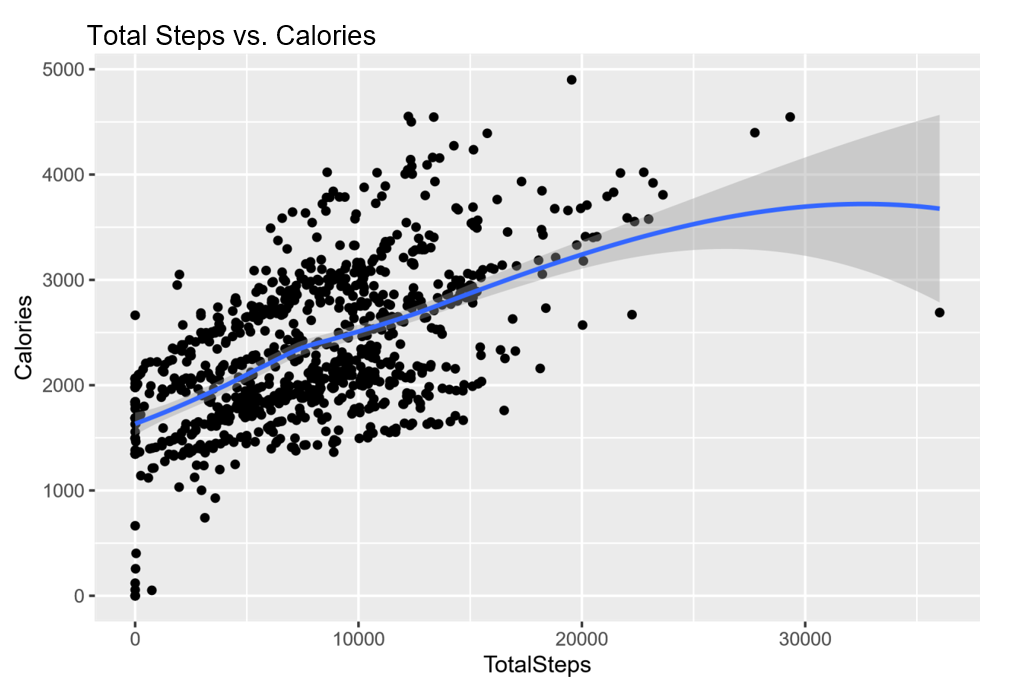
4.3 Relationship between Steps and Calories

The plot above illustrates the relationship between the total steps taken and the total calories burned.The points are scattered across the plot, suggesting that there is a positive correlation between steps and calories burned. As the total steps increase, the total calories burned also tend to increase.
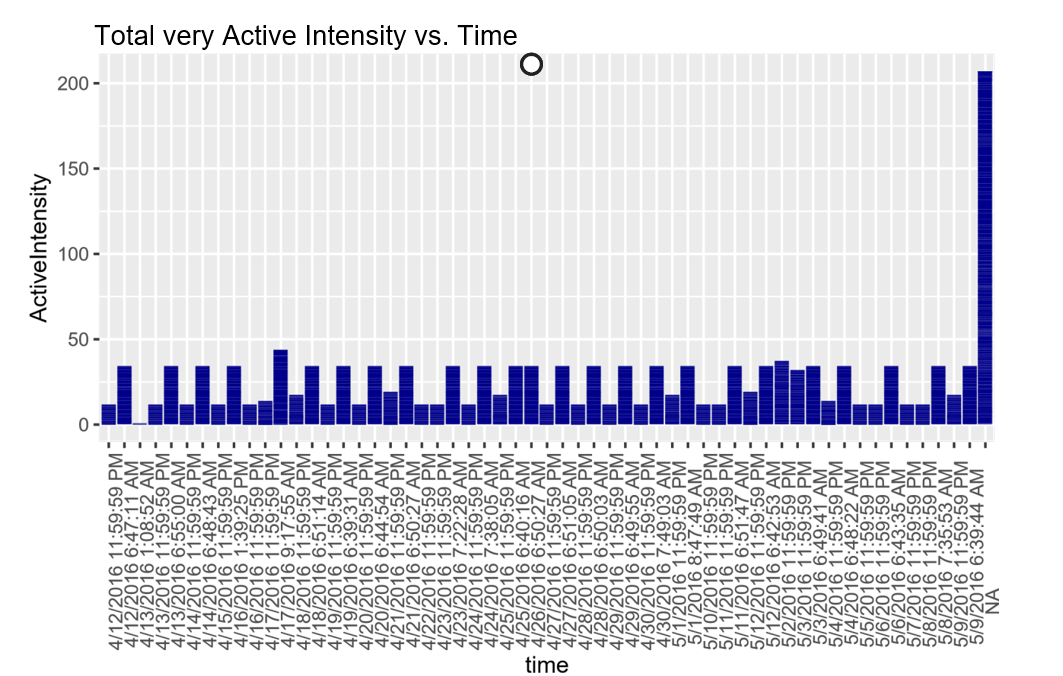
4.4 Intensities Data

The above histogram displays the distribution of very active intensity levels throughout the day. The x-axis represents the time of day, and the y-axis represents the proportion of very active minutes. The histogram shows how the proportion of very active minutes varies at different times of the day. It helps identify peak times of activity and understand participants' activity patterns.
5. Conclusion
Based on the data analysis and visualizations, it is evident that there is a need for interventions to promote physical activity, improve sleep patterns, and reduce sedentary behavior among the participants. Implementing targeted marketing campaigns, workplace wellness programs, and personalized activity plans can lead to positive behavioral changes. Furthermore, offering educational materials and workshops on sleep hygiene and providing incentives for achieving daily step count goals can significantly enhance overall well-being.
6. Recommendations
Based on the analysis, the following recommendations are proposed:
- Develop a targeted marketing campaign to educate and motivate individuals to reduce sedentary time.
- Design interventions to increase physical activity levels among users.
- Offer educational materials and workshops to improve sleep hygiene.
- Implement step-counting challenges and incentives to encourage achieving recommended daily step counts.